Posts

Showing posts from June, 2018

Bargarph with factor categories

Image
See Video   ⮞  ☝ AGRON Stats Lectures July 23, 2020 Introduction Import data set Get summary statistics Compute standard error Define variable names Upper bounds of error bars Matrix of mean and SE Plot bargraph for interaction term Introduction This tutorial is in continuation of the previous one on strip_plot_analysis If you have not gone through the previous tutorial I would suggest first you should have a look at this. Points of learning: * How to plot interaction bar graph with factor categories * How to show standard error bars on top of the graph bars. Import data set I often recommend to first clear all the objects or values in global environment using rm(list = ls(all = TRUE)) . You can also clear the plots using graphics.off() and clear everything in console using shell() function. rm ( list = ls ( all = TRUE )) graphics.off () she
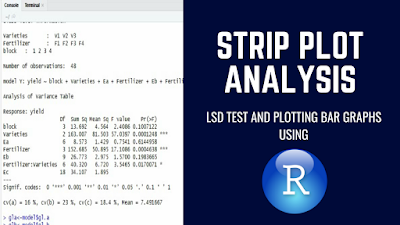
Strip plot analysis using R

Image
See Video   ⮞  ☝ AGRON Stats Lectures June 26, 2018 Introduction Example data set Import data Fit analysis of variance model LSD mean comparison test Compute mean and standard error Visualize effects Plot varieties Plot gender Plot interaction Introduction In this tutorial you will learn how to carry out statistical analysis for strip plot or split block design using R program. Strip plot design is specifically suited for a two factor experiment. In this design, the desired precision for measuring the interaction effect between the two factors is higher than that for measuring the main effect of either one of the two factors. This is accomplished with the use of three plot sizes: Vertical strip plot for the first factor also called the vertical factor. Horizontal strip plot for the second factor also called the horizontal factor. Intersection plot for