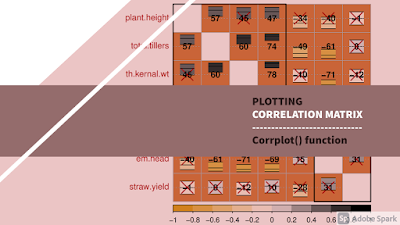
Plotting correlation matrix | corrplot() function | Rstudio
See Video ⮞ ☝ AGRON stats March 21, 2021 Introduction Correlation analysis Plotting correlogram The argument “method” The argument type The argument order Customizing color palettes Color label position Background color Text label rotation The argument addrect Add confidence interval Apply test to get CI Display CI in plot Introduction In this tutorial you will learn how to get a graphical display of correlation matrix using corrplot() function in Rstudio. So lets get started! As a first step, I always recommend to clear data objects and values in global environment with rm() function. Set TRUE value for the argument all to remove objects and values if you have created earlier. Shut down all the graphic windows by using graphics.off() function. Putting the value “cls” in shell() function will clear the console environment. rm ( ...